Many communities across Canada have a Crime Prevention, Community Safety, or Community Safety & Well Being plan, and are grappling with how to measure its ongoing progress and results. Monitoring safety indicators and evaluating comprehensive multi-sector initiatives is not as straight-forward as evaluating a single program. Community safety and well-being are shaped by many interconnected factors at the individual, family, community, and system levels. Monitoring police-reported crime rates is only a small piece of the puzzle, and it is simply not representative of the bigger picture.
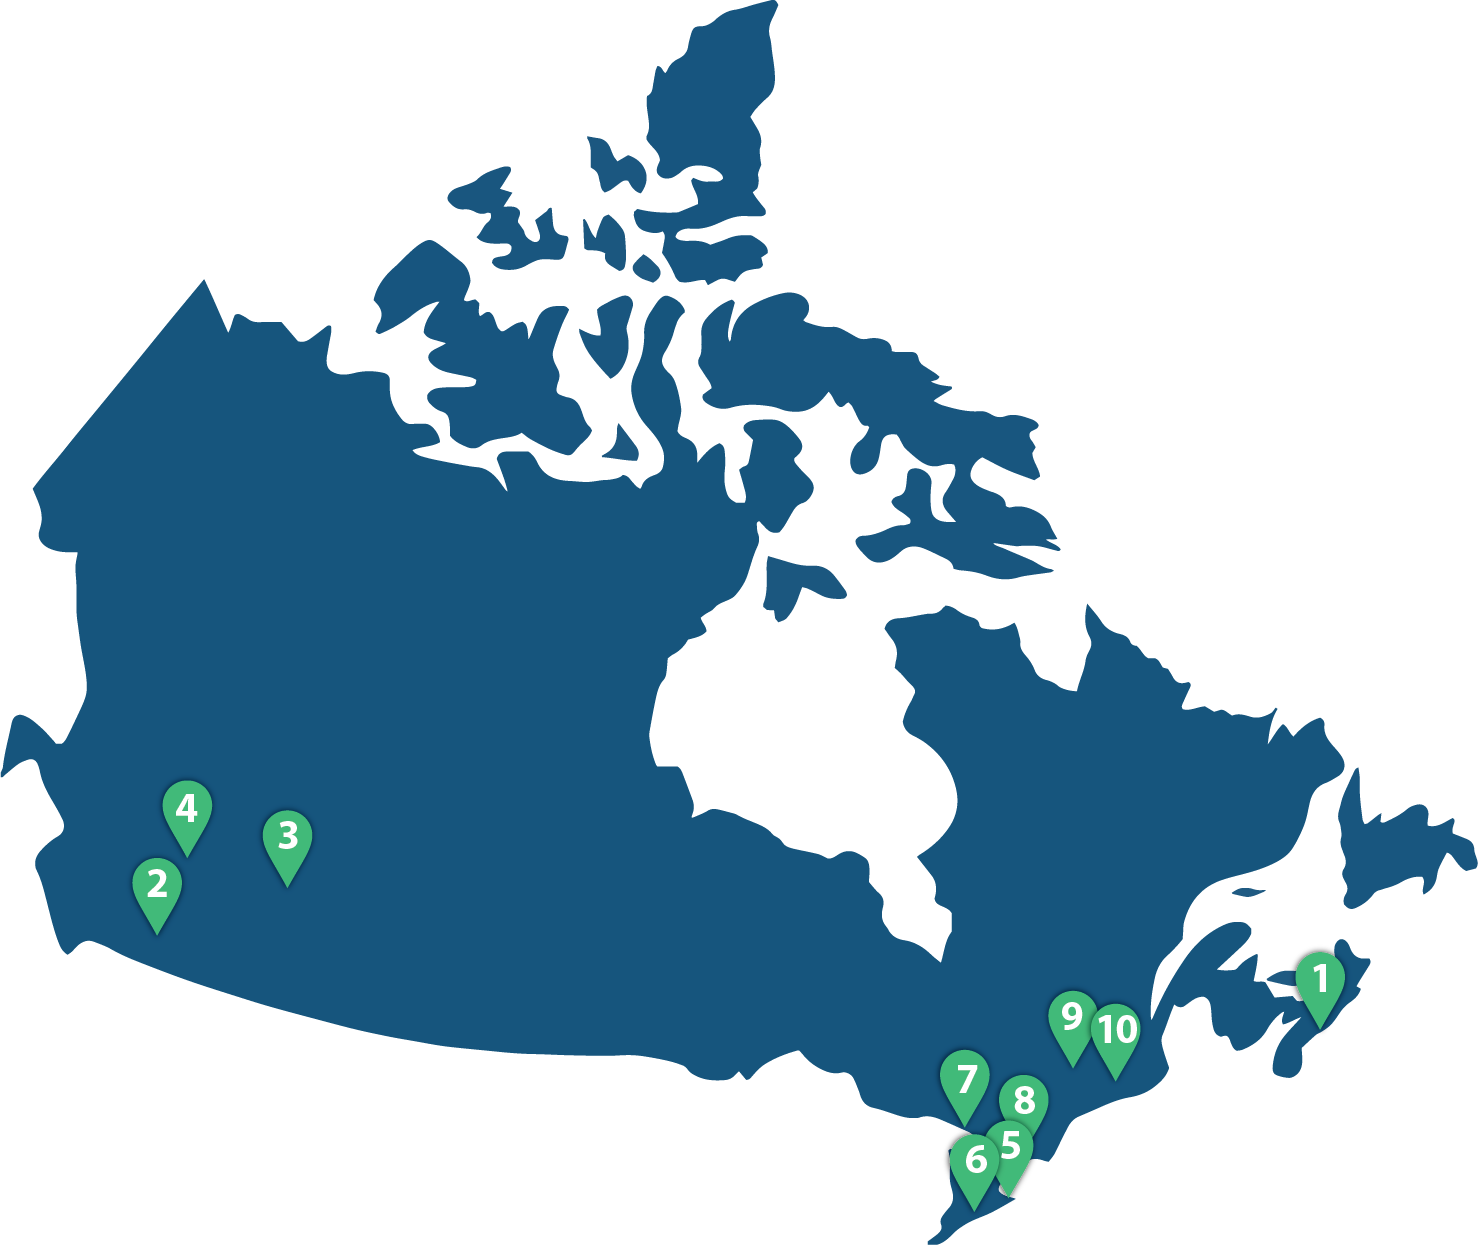
The project was led by the Canadian Centre for Safer Communities (CCFSC) and inspired by the global Urban Safety Monitor (USM) supported by UN-Habitat. CCFSC worked with 10 pilot site municipalities across Canada, and was supported by Indigenous, national, and international advisory partners.
See here for more information about the CUSM Project background, and below for the project advisors and pilot sites.
CUSM Pilot Sites
Across communities, various partners – including sector leaders, local practitioners, community partners, resident champions, government staff, and elected officials – are increasingly working together to support community safety in interconnected ways. The root causes and social determinants of safety have been increasingly valued internationally and across Canada, mirroring the earlier movement for the social determinants of health.
There is growing recognition that intersectional challenges including poverty, racism, discrimination, intergenerational trauma, and the lasting impacts of colonialism, result in inequities and the overrepresentation of Indigenous and other racialized people in the criminal legal system. Many of the larger systems set up to address issues of crime and safety – including the criminal legal system (police, courts, corrections) – are not aimed at tackling root causes or improving underlying conditions for safety.
To truly improve safety, communities need strategies that promote equity, early prevention, targeted intervention, and people-centered responses. This means that the objectives of community safety and well-being are broad, and so are their related indicators.
While police-reported crime statistics can provide some information, community safety is about so much more. Monitoring and evaluating community safety initiatives using a range of indicators promotes evidence-informed decision-making, continuous improvement of efforts, accountability for change, celebration and recognition of successes, and sustainability.
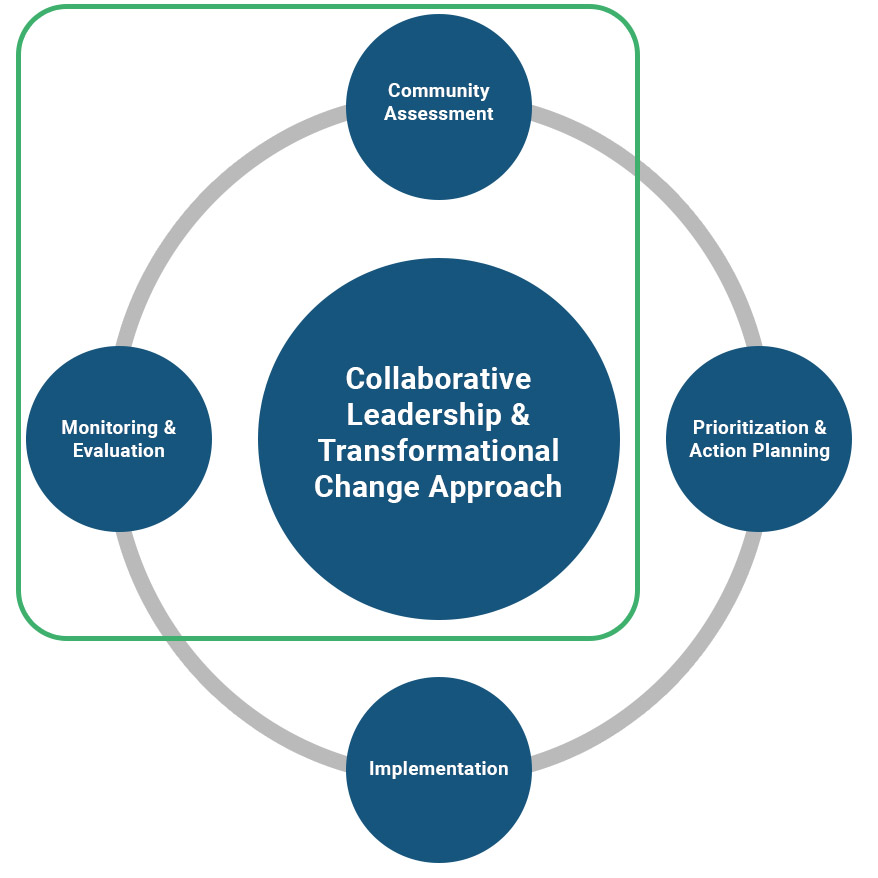
Evidence-informed community safety planning generally follows four main phases, all supported by local multi-sector collaboration. At CCFSC, we call these phases:
Too often, monitoring and evaluation are an afterthought. This toolkit aims to bring monitoring and evaluation into the forefront and promote evaluative thinking at every stage.
Monitoring is the systematic collection of information to track progress about an intervention over time, often part of performance measurement. Monitoring is typically used to:
Evaluation is a more in‑depth, systematic assessment of the design, implementation or results of a policy, service, or program. Evaluation is used to:
Importantly, the work done during the Community Assessment phase is also very relevant to monitoring and evaluation. Community Assessment typically involves gathering existing data and information about a community, as well as engaging with diverse groups to explore and identify local strengths, needs and gaps. The information gathered during this community assessment phase should serve, when relevant, as “baseline” information about the state of safety and its underlying factors in the community prior to comprehensive and collaborative planning. So, the key indicators and measures of safety and its related factors are important to think about for community assessment as well as for ongoing monitoring and evaluation.
Together, community assessment, monitoring, and evaluation provide a clearer picture of progress and impact, helping communities learn, adapt, celebrate successes and improve over time.
For more information on how CCFSC is defining terms related Monitoring and Evaluation, see our Toolkit Definitions Page.
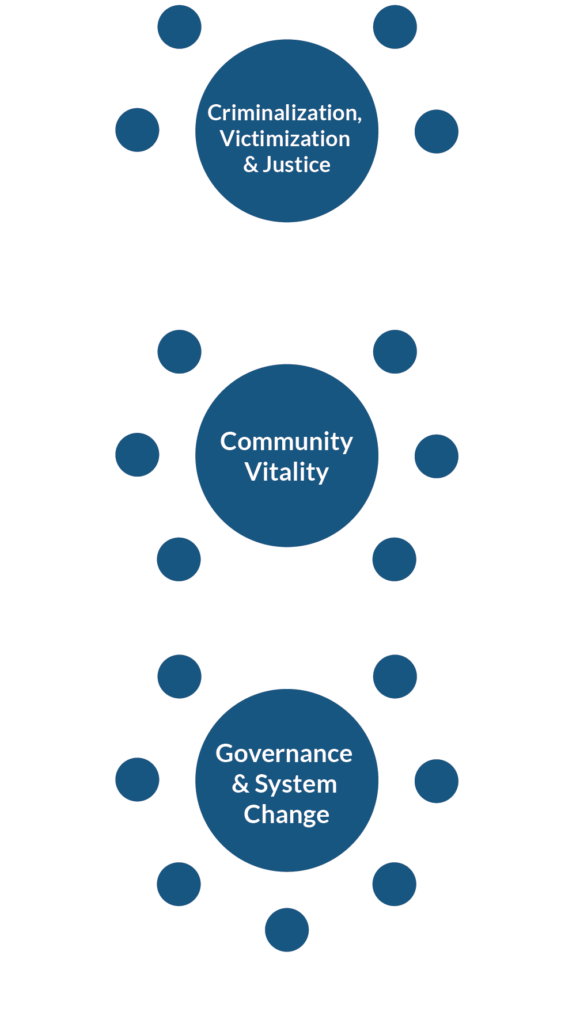
Community safety and well-being are influenced by many interconnected factors associated with criminalization, violence, and disorder, including risk and protective factors at the individual, family, community, and system levels. To make this complexity easier to navigate, this toolkit organizes indicators into three core domains:
These three domains create a systems level picture of safety, which correspond to the themes under the Urban Safety Monitor (USM) supported by UN-Habitat. These domains help communities focus on a balanced set of indicators that reflect root causes, equity, prevention, community context, and system performance. Together, the domains support communities to:
These indicators and their related measures were identified through a comprehensive review of existing indicator frameworks and datasets relevant to community safety. In addition, Indigenous perspectives were included throughout and within the core domains.
Safety is when there are no threats to mental, physical, spiritual, or emotional wellbeing.
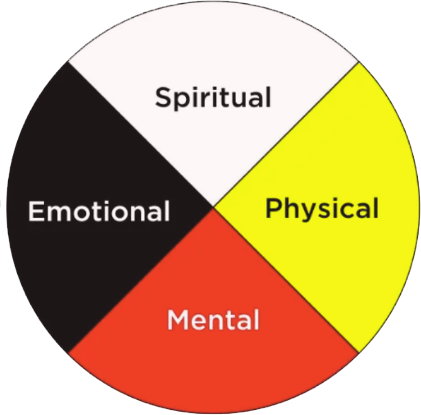
This definition of safety was co‑developed with several Indigenous community members through 10 sharing circles and 5 interviews held during the CUSM project. Participants were invited to define safety in their own words, many drawing on the medicine wheel’s four dimensions of well‑being. This definition was then used to inform broader conversations about indicators to be added or adapted for the project’s output.
Examples of Indicators from each dimension of the medicine wheel:
Community care emerged as a foundational element of safety. Participants described safety as coming from strong relationships, mutual support, and everyday acts of looking out for one another (e.g., helping neighbours, informal watchfulness).
Example measure: Trust in neighbours
Participants identified traditional values, cultural practices, and Indigenous languages as both strengths and areas in need of revitalization. People reported feeling safest when they could practice culture, uphold values, and speak their languages without barriers.
Example measure: Participation in traditional cultural activities and ways of life
Experiences with policing, courts, and incarceration surfaced as major contributors to feeling unsafe. Many participants described deep mistrust of these institutions, shaped by historical and personal experiences.
Example measure: Trust or confidence in police
Racism and discrimination were frequently described across daily life, health care, education, and other institutions. These experiences were tied to emotional and psychological impacts.
Example measure: Psychological distress linked to past year exposure to racism or aggression
Within these three main domains, there are many sub-domains, and an extensive list of indicators each with specific measures and data points that could be used. For example:
| Core Domain | Sub-domain | Indicator | Sample Measures |
|---|---|---|---|
| Criminalization, Victimization & Justice | Personal security | Perceptions of safety |
|
| Community Vitality | Human rights & basic needs | Housing |
|
| Governance & System Change | Political & community security | Multi-sector collaboration |
|
The indicators and measures included in this toolkit were identified based on decades of research on effective community safety, CCFSC’s years of experience in local community safety work, as well as on the advice and input of the project’s advisors and pilot site representatives. The indicators and measures chosen for inclusion are based on the following rationale:

Risk & protective factors exist at every level (individual, family, community, system)

Vulnerability increases when risk outweighs protection

Meeting basic needs, human rights, and addressing inequities

Supporting positive development and healthy relationships

Fostering community connection and resilience

Strengthen governance & shared direction around desired results

Centre reconciliation, inclusion, and diversity

Prioritize evidence-informed practice & continuous learning

Make targeted, meaningful, and sustainable investments

Reduced criminalization, victimization, violence, and insecurity

Improved community health and safety

Increased feelings of safety

Reduced reliance on justice systems

More efficient and less costly systems

Greater social and economic returns

Stronger community vitality

Safety becomes achievable and sustainable

Systems maintain improvements in well-being and vitality
To review these indicators and their measures in more detail, consult our Indicator Explorer & Customizer tool! This tool provides a long list of the key indicators related to community safety and well-being, examples of specific measures and data points that can be used, as well as existing data sources in Canada and other relevant data collection methods.
Since every community has finite resources and may not be able to include 30+ indicators and 200+ measures in their CSWB plans, it is important to highlight which indicators advisors consider most important for CSWB work. Based on CCFSC’s years of experience in local community safety work in Canada, as well as advice and input from the CUSM project’s advisors and pilot sites, Core Indicators are identified in the Indicator Explorer & Customizer tool (also listed here).
Effective monitoring and evaluation do not require perfect data or complicated systems. What matters most is choosing methods that are meaningful, manageable, and grounded in community needs and experience. The tips below can help communities of all sizes develop a monitoring and evaluation approach that fits their capacity and supports continuous learning.
There are several foundational tools that help describe the many complex elements of an initiative in simplified ways, which can make planning much easier. Both Logic Models and Theories of Change are great tools for informing program design, planning, learning, evaluation, and accountability. These tools are extremely complimentary, and any initiative could benefit from either or both.
A structured, simplified list of program elements, typically in a table showing the linear sequence of inputs → activities → outputs → outcomes. It summarizes what the program does and its expected results.
When to Use:
Best for linear depictions of flow where a single, straightforward sequence is sufficient. Causal logic is implied rather than fully theorized. Often considered a good starting point.
A visual description and (ideally) an accompanying written narrative that explains how and why a program is expected to achieve its intended outcomes. This helps visualize or describe the “causal chain,” and is supported by capturing other nuances, including underlying rationale/evidence, assumptions, and external factors.
When to Use:
Suited to complex, multi‑level, or non‑linear change, especially when supporting strategic thinking.
For more information on these tools, see here.
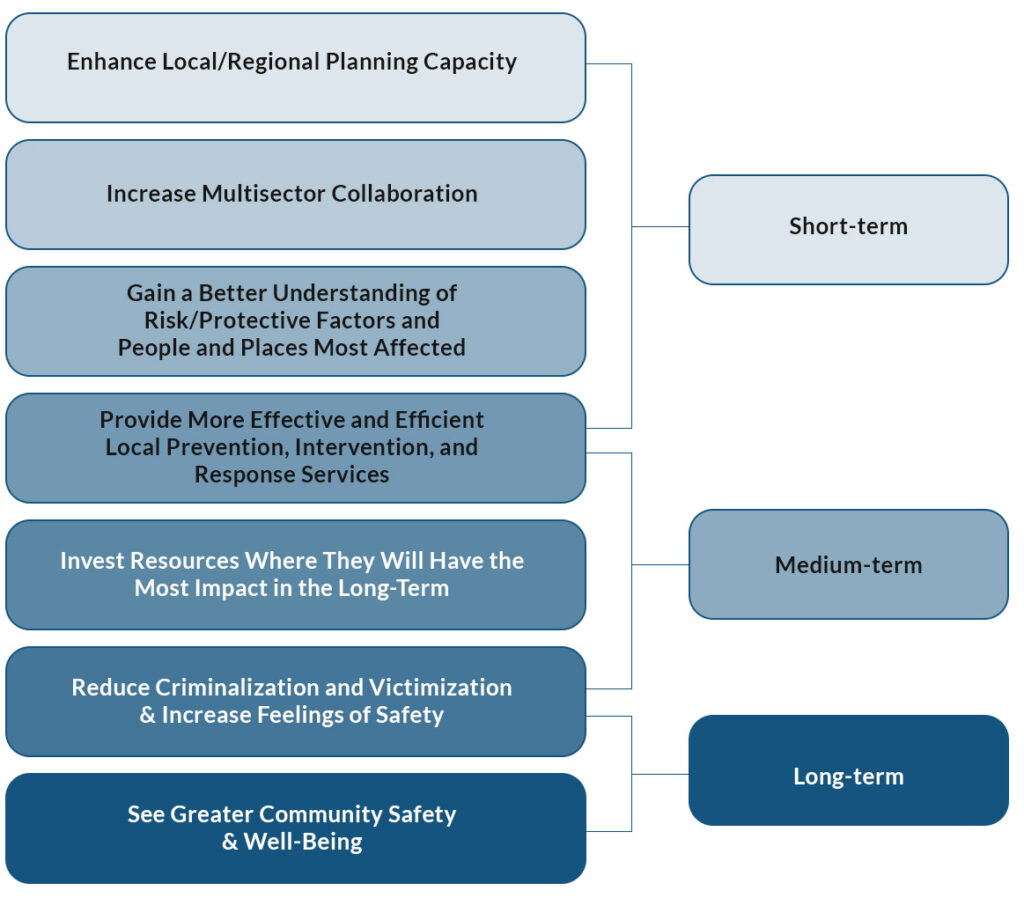
Generally speaking, CSWB strategies across Canada strive for similar high-level outcomes in the short-, medium-, and long-term. These can serve as a starting point for developing a Logic Model or Theory of Change, adding details specific to your local CSWB priorities and actions.
There are three main types of data that should be included in community safety assessment, monitoring, and evaluation. For those communities with higher capacity or farther along with their evidence-building journey, hover over the diagram to explore examples of data at the intersections of these categories.

Service level data
Community engagement data
Population level data
A city-wide survey co-designed with service partners and residents, reported both for the entire population and by client group.
Lived experience input combined with service stats in a way that informs service changes.
Service administrative data aggregated to regional totals (e.g., total shelter usage city-wide).
Community surveys that run citywide (e.g., perception of safety).
These data can be gathered using a combination of different methods. In community-based monitoring and evaluation, using a mix of quantitative and qualitative data collection methods is considered best practice.
To collect the various types of data relevant to community safety and well-being and gain a full picture of the local context, it is best to combine quantitative and qualitative data collection methods.

There is a long history of extractive research on Indigenous peoples rather than with Indigenous peoples. This history has led to understandable mistrust and hesitation around research, monitoring and evaluation activities among Indigenous peoples.
As Linda Tuhiwai Smith (2012) said “The word itself, ‘research’, is probably one of the dirtiest words in the indigenous world’s vocabulary. When mentioned in many indigenous contexts, it stirs up silence, it conjures up bad memories, it raises a smile that is knowing and distrustful.”
This history points to the importance of doing evidence building with Indigenous partners in a good way. Wilson (2008) identified respect, reciprocity, and relationality as the three pillars of Indigenous research. Recent guidance from Public Safety Canada’s Indigenous Evaluation: Bridging Perspectives event report (2025) reinforces the same priorities: emphasizing trust‑building, community‑led direction, clear communication, and approaches that honour Indigenous sovereignty and self‑determination.
Below are some high-level recommendations drawn from the CUSM project’s Indigenous-led Review and CCFSC’s broader learnings in supporting M & E with Indigenous partners. These are complemented by learnings that strongly align with the themes identified in Indigenous Evaluations: Bridging Perspectives (2025).
Practical Tips:
Collecting, sharing, and using data for CSWB work often runs into practical and ethical hurdles, including capacity, data ownership, privacy, data quality, and how results are used. The table below summarizes common challenges we see across communities and a few examples of practical solutions that keep work moving while centring community benefit, cultural safety, and evidence quality.
Scan the table to identify issues you’re facing and which immediate actions or longer-term practices you might work towards.
| Data Theme | Common Challenges | Common Solutions |
|---|---|---|
| Human & Financial Capacity |
|
|
| Data Ownership |
|
|
| Privacy |
|
|
| Data Handling & Liability |
|
|
| Data Quality |
|
|
| Data Usage & Reporting Back |
|
|
Building on these considerations, here are some templates that can help overcome some of these data challenges.

This section provides practical guidance for communities ready to move beyond light‑touch methods and begin developing a more structured Monitoring & Evaluation (M&E) plan for their CSWB efforts. Each component can be adapted based on local capacity, context, and priorities.
A monitoring & evaluation plan is a short document that outlines what you want to learn, how you will measure progress, and how results will be used to strengthen CSWB strategies. It helps partners stay aligned, clarifies expectations, and supports ethical, transparent, and systematic learning. A strong M&E plan includes:
M&E plans should be concise, practical, and easy to update as work evolves.
| Question Type | Purpose | CSWB Focused Examples |
|---|---|---|
| Monitoring Questions | Track activities, outputs and reach to understand what is happening in real time. |
|
| Process Evaluation Questions | Examine how work is being delivered and whether implementation is happening as intended, and with the quality expected. |
|
| Outcome Evaluation Questions | Assess short or medium-term changes for individuals, organizations, or communities. |
|
| Impact Evaluation Questions | Explore longer-term, system level shifts aligned with CSWB goals. |
|
| Cost / Efficiency Evaluation Questions | Understand whether resources are being used effectively and proportionately. |
|
Headline indicators – A small set of high‑value indicators identified by any community that best reflect their core CSWB priorities. These indicators should be meaningful to both community partners and decision makers, as well as feasible and reliable to track in the near term.
There are many ways to build Data Development Frameworks, depending on the needs of your team or project. See examples below.
| CSWB theme/priority | Sub-theme | Indicator | Data availability | Measure | Measure definition | Availability at population level | Availability at local level | Data Collection Frequency | Person / Team Responsible | Status |
|---|---|---|---|---|---|---|---|---|---|---|
| Community Vitality | Housing | |||||||||
| Health care | ||||||||||
| Education |
Clear, ethical communication helps ensure that monitoring and evaluation findings are understood, trusted, and used for change. This section offers practical guidance and tools for sharing results with partners, community members, and decision‑makers in ways that build alignment, support learning, and reinforce community ownership.
Share findings across partners and sectors to understand what’s working, where adjustments are needed, and how to prioritize next steps. Transparent, ethical sharing supports alignment and coordination across teams and ensures evidence meaningfully informs collective decision-making.
Present results in accessible, culturally grounded formats, such as stories, dashboards, visual summaries, and interactive maps to build trust and support meaningful participation.
When Not To Share Results
While transparency matters, there are times when sharing results may cause harm or confusion. Consider pausing, adapting, or delaying communication when:
A short pause to reassess safety, clarity, and readiness can protect relationships and ensure findings are used responsibly.
Seek opportunities for bi-directional sharing of lessons learned across the wider CSWB landscape to help build more consistent, evidence-informed strategies. Participation in CCFSC’s Membership Network is a great place to start, and includes many of the effective channels below:
Treat results as a shared resource, owned by communities, not individual organizations, to support transparency, trust, and collective action.
Integrate findings into planning cycles:
Use evaluation findings to update CSWB plans, refine strategies, inform budgets, and guide long-term systems change. Set a regular cadence for reviewing results (e.g., quarterly or annually) to sustain a continuous improvement loop, ensuring plans remain responsive, evidence informed, and aligned with community priorities.
Use evaluation findings to update CSWB plans, refine strategies, inform budgets, and guide long-term systems change. Set a regular cadence for reviewing results (e.g., quarterly or annually) to sustain a continuous improvement loop, ensuring plans remain responsive, evidence informed, and aligned with community priorities.
See below for additional communications-related resources:
| Format | Description |
|---|---|
| Stories |
|
| Dashboards |
|
| Interactive maps |
|
| One-page briefs |
|
|
Visual summaries (infographics, charts, maps) |
|
| Technical reports |
|
Use this tool to explore the thorough list of CSWB indicators and measures compiled for this toolkit, and to create a customized list for consideration in your community.
This tool is designed to help build a monitoring and evaluation plan that supports CSWB continuous learning and improvement. A mixed methods approach, combining quantitative and qualitative data, is recommended.
Communities are encouraged to leverage data that already exist at regional, provincial, or national levels; and explore collecting other measures locally through engagement, surveys, partners’ administrative data, and story-based methods.
Please see our recommended citation information for this toolkit below. Note: this toolkit is a living resource that will continue to grow and evolve as our team learns, deepens its practice, and collaborates with communities. Minor inconsistencies may appear; we welcome feedback and will make reasonable updates as capacity allows.
